Google Analytics Reports for Clients (Examples & Tools)
Editor’s note: this article is a guest post by our good friend Jean-Phillipe Boily, founder of Metrics Watch. He’s an expert in everything Google Analytics (he also wrote about GA custom alerts), so you're in good hands here! ;)
Google Analytics can be overwhelming.
There’s so much data.
Finding relevant insights is challenging for us tech-savvy folks, so imagine how puzzling it is for non-technical users.
As web developers, we all encounter clients who don’t understand Google Analytics, or don't have the time to do so. Initially, they often dive right in, trying to figure it out. But in the end, they take very few actions based on their data.
So they visit GA less and less.
I understand them. They have a business to run, and Google Analytics doesn’t seem to help them do this at first—but it can.
It should.
Especially if they're running e-commerce businesses!
Google Analytics helps us find out which efforts or content work. It makes it easier to make good decisions, repeat successful marketing initiatives and, in the end, make more money!
In this post, I'll go through 5 examples of life-changing Google Analytics reports for your clients.
By the end of this, you’ll be able to show your clients, especially e-commerce owners, better success measurements than sessions and bounce rate (hint: we don’t care about those metrics that much).
Each of these reports will answer a crucial question that keeps merchants up at night. Trust me, they’ll be thankful for that.
I also have some tools suggestions for automating your clients’ GA reports, so keep reading until the end to not miss anything!


Report 1: Which marketing channels are working?
The first step to a better understanding of which marketing decisions work is taking a high-level look. Let’s see which channels are the most valuable.
If you're analyzing an e-commerce website, I assume you have Google Analytics’ Enhanced Ecommerce configured.
What we want to understand here is where the money is coming from; that’s how we measure the business impact of marketing efforts.
The first report we’ll be looking at is in the “Acquisition” section of Google Analytics, in “All Traffic” → “Channels.”

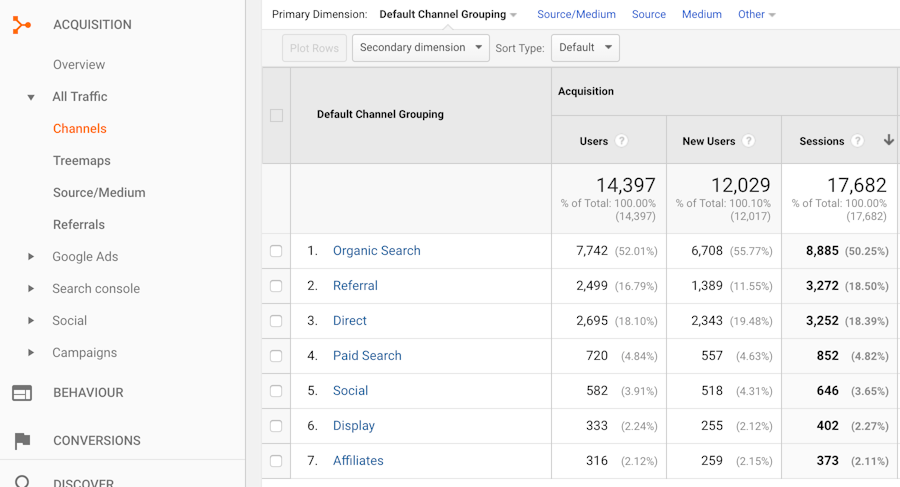
In this report, we can see which channels are bringing the most visits. In this example, the top 2 (Organic Search & Referral) bring 68% of the traffic. This looks like an excellent place to start, right?
What does each channel represent?
Organic Search: searches on Google and other search engines. Mostly Google—Bing, Yahoo, and DuckDuckGo are far behind in terms of volume.
Referral: visits that are coming from another site, which decided to add a link to your site. It could be reviews, influencers, and whatnot.
Direct: that’s traffic for which GA can’t identify the source. Example: someone types your URL directly in their browser, without going through a search engine. It can also be someone clicking a link in a native application (mobile or desktop), which will open in the browser and often not include enough information for Google Analytics to understand it’s provenance.
Paid Search: that’s Google Ads, formerly AdWords.
Social: social networks like Facebook, Twitter, Quora, Reddit, and more.
Display: banner ads you buy.
Affiliates: affiliate links to your site.
On the previous screenshot, we see sessions per channel, but sessions are not worth much ultimately. Visits to a site don’t pay bills, conversions do!
I cheated there and showed only parts of this report. Let’s expand it now.

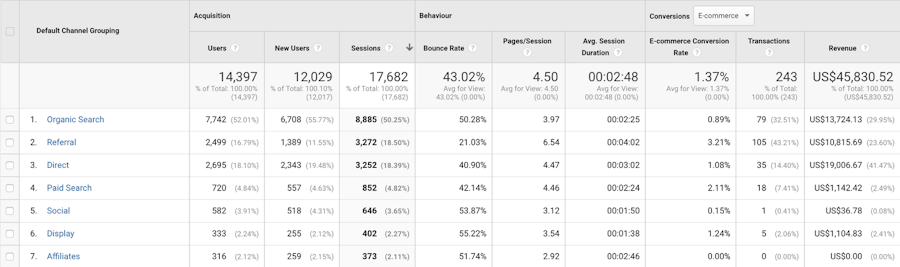
Better. Now we can see that each channel has different revenues, conversion rates, and engagement rates. Based on that and your business knowledge, you can start answering more specific questions.
Here are a few examples of insights you should extract from this screenshot:
The conversion rate from social networks is super low, which is not uncommon.
Revenue from Direct is high, which makes sense as the users entering from there possibly already knew you and came to buy.
Most money is coming from organic, referrals and direct traffic.
Conversion rate from Referrals is pretty high.
Conversion rate from Paid Search is decent. It brings some money in, not a ton, but we can add some context--ads spend + time invested + margins. May be worth scaling that acquisition channel?
Affiliates are bringing some light traffic but not a single sale whatsoever. Is it worth pursuing? Is there a misalignment between your affiliate message and your landing page? Can you work with your affiliates or influencers and see why no one is buying? Only you can tell for your own clients, but in this specific case, it looks like a weak channel.
Then again, there are variables absent from this report that you need to add to your thinking process:
The efforts (money & time) deployed to get these results.
The additional efforts you’ll have to put in these channels, so they continue to get you sales.
Your ROI for paid advertising, as we don’t have the costs here.
We now have a good sense of what seems to be working and what doesn’t. But we want more details, right?
Report 2: Where precisely are converting users coming from?
In other words: what individual marketing efforts have the best results?
We can look at that by going in “Acquisition” → "All Traffic” → “Source/Medium.” I must confess: this is my favorite Google Analytics report, by far.

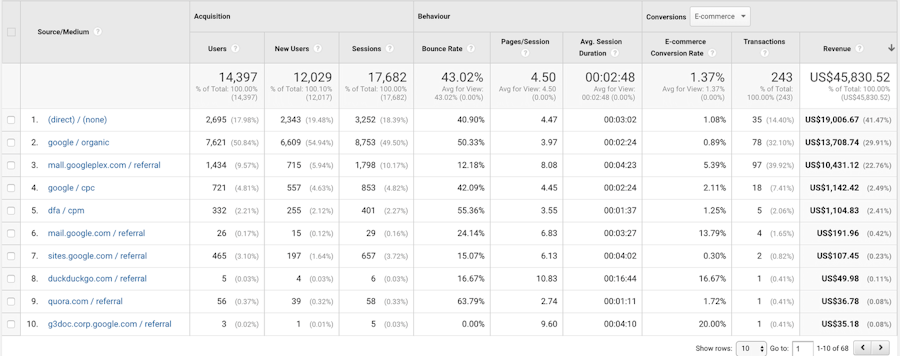
Once again, there is a LOT of revenue coming from direct traffic here. But we can also see Google search, and referrals from “mall.googleplex.com” are very valuable.
Interesting. What can you do with this information?
You could start digging more into all the full referrers to see where are the links to your site on strongly performing referral sources (like mall.googleplex.com here). In some cases, it could be from reviews or influencers. Can you reproduce this? Can you get more traffic from that source? It has a high conversion rate sitting at over 5%. Maybe there are co-marketing efforts that could be done to advertise this content by the original author, paid by you, with revenue sharing, for example.
The critical part here is to understand what works so you can do more of it and find new ways to capitalize on it.
Report 3: How do I identify ROI for paid campaigns?
What about advertising? You’re putting money in Facebook Ads, Google Ads, Reddit Ads, NameIt Ads (not a thing, but you get it). It’s all great, but the idea is to make a profit out of it.
The fun part is that Google Analytics lets you track everything. You can know how much money your individual campaigns bring, then compare to the cost and see if it’s worth pursuing them, tweaking copy & creatives and/or scaling budget.
Next report is in “Acquisition” → “Campaigns” → “All Campaigns”

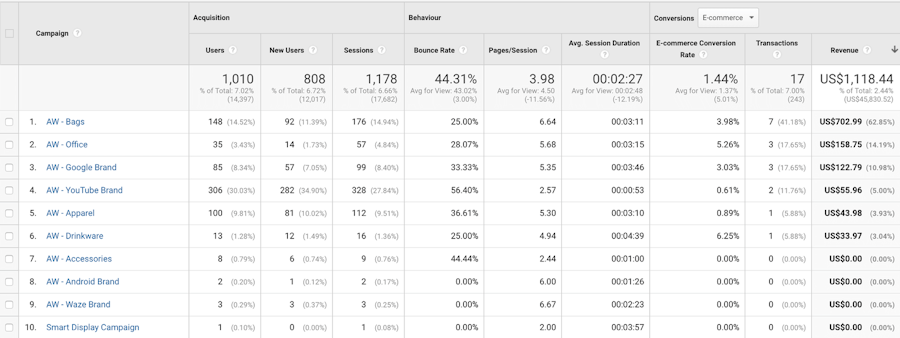
Similar to the previous reports, we can see revenue, conversion rate, and all that jazz, for each campaign. Now you can compare with your costs and decide what to do next with your online advertising budget.
Quick note: the campaign name will not appear there by magic. You need to use UTM parameters. If you don’t know what they are, you can get details here and use this campaign URL builder. UTMs will work with all advertising platforms; you need to build your URLs properly.
Report 4: Which products are selling the most?
“Hey, we already know this by looking at our inventory, buddy.”
Yes, that’s true, but I can help you sell more of them. ;)
How?
If you use a full-fledged e-commerce platform with a cart and everything, like Snipcart (¯_(ツ)_/¯), you have access to Google Analytics Enhanced Ecommerce which gives you a lot of great information like funnels (that I might cover in a different post) and the list of best-performing products.
What’s so cool about this? Adding context to these sales. Understanding which products are selling the most by source/medium or by campaigns.
We can see popular products in the e-commerce overview, but we want to dig deeper.
Go to “Conversion” → “E-commerce” → “Product Performance.”

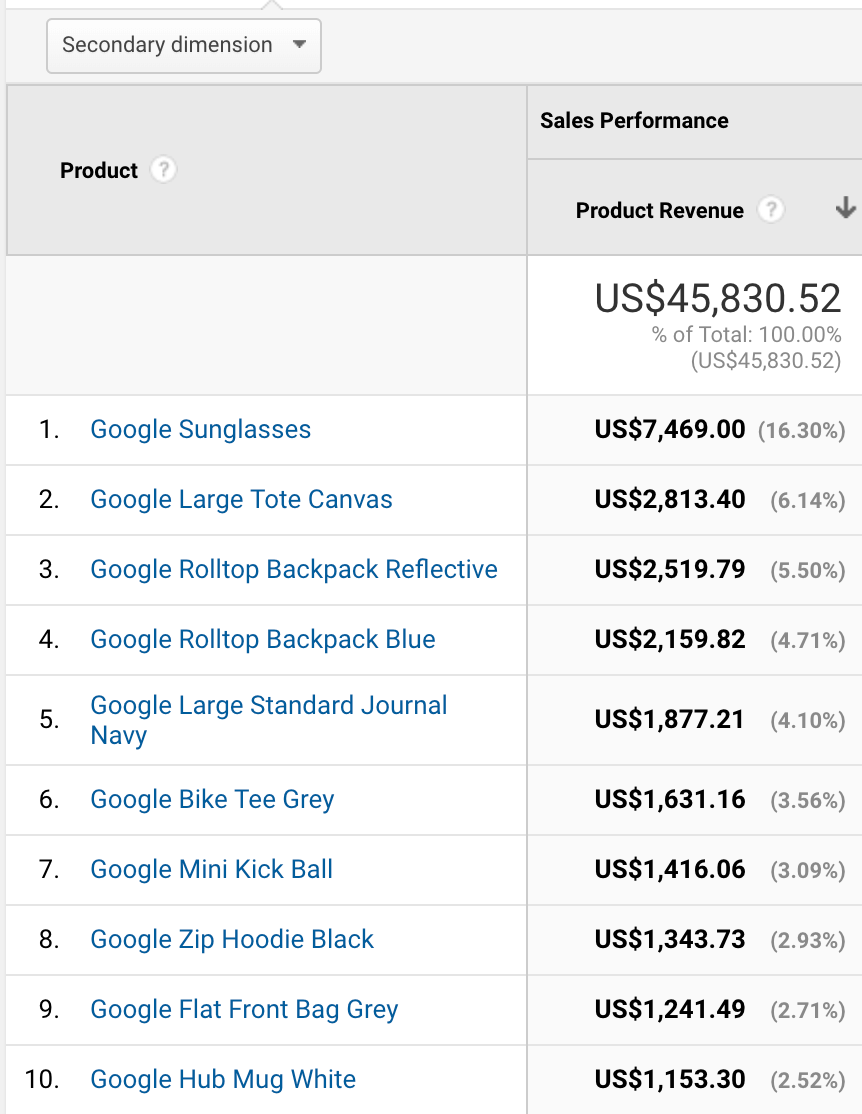
This is a list of products with the highest revenue. Cool, but we still want to go further.
See the “Secondary dimension” drop-down at the top of this screenshot? It’s used to add a secondary dimension to our report, which will make it more insightful by pairing products & source/medium with their revenue.
To see this, click on the secondary dimension drop-down and select “Source/Medium”.

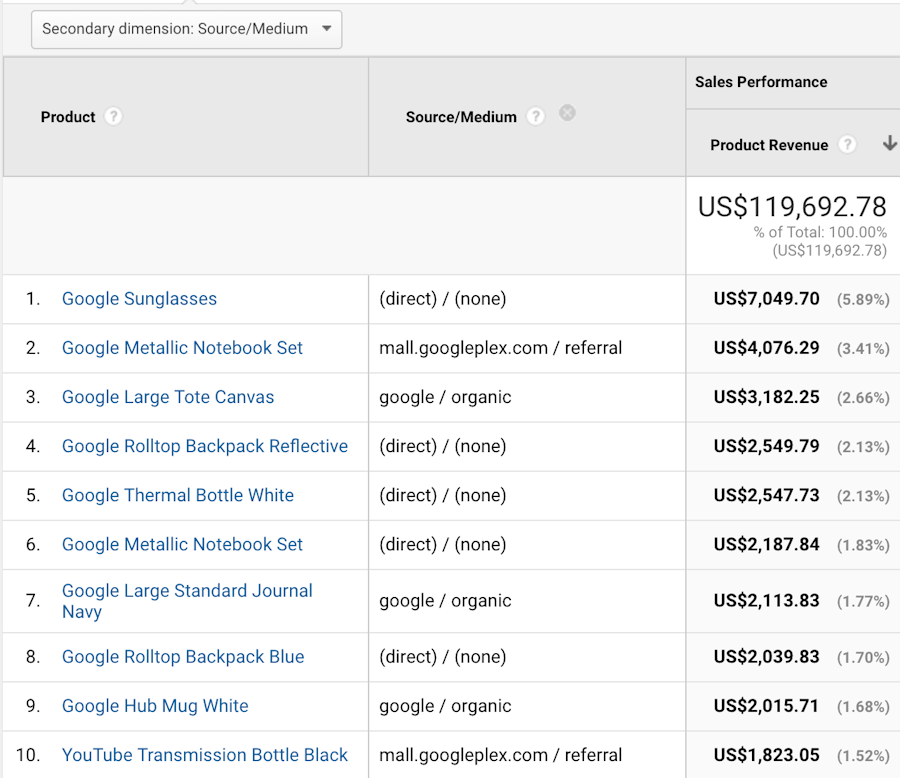
You now know what products sell, per source/medium.
This screenshot doesn’t do this technique justice as this example data is from a demo Google Analytics account.
However, know that I’ve seen people realize that a few products from a single channel are responsible for over 10 percent of their revenue. Such a revelation can be HUGE!
It’s also possible that there are no clear winners for you. It’s different for each site. But sometimes, you see that one item or a handful of items performing really well through a specific channel. You can then start to brainstorm on how to sell more of these, improve conversion rate, etc.
Personalizing some pages based on the source of traffic or patterns could be a great idea here. With traffic coming from influencers, for example, you could add a mention to your landing page saying “Hey, we also love [influencer]” or even use a testimonial from that person!
Report 5: What about conversions from landing pages?
Knowing which channels and marketing efforts are getting results is fantastic.
But let’s go even further and try to understand which mix of landing page + source/medium + campaign name (if applicable) increases a business’ earnings.
For that, you need to create a custom report or use this link to import the one I kindly made for you.

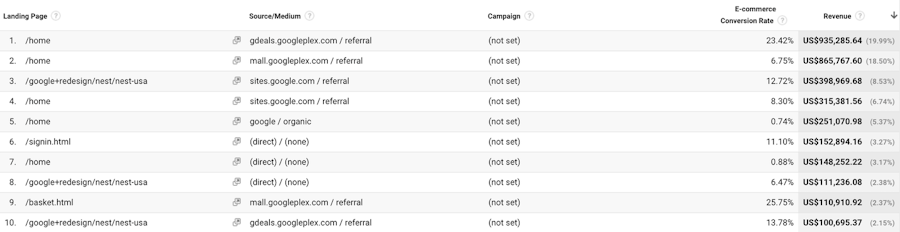
That one can also work for sites that aren’t e-commerce. Check out the import link above; I made a bonus tab if you use goals instead of Enhance E-commerce.
Yes, you could look at revenue per landing page, but this view is going to be a lot more useful in general and tell you a lot about what works the best and has the most impact on the business.
Automating reports: Google Analytics survival kit for your clients
You should take the time to show your clients how to use GA, how to find these report and appropriately read the data. Trust me though, I know from experience that a lot of your clients won’t go as often as they should.
To help them make wise decisions and understand their ROI on marketing efforts, you can (and should) automate the sending of reports/dashboards to your clients.
Three questions probably just popped in your mind, right?
How can I do that?
What should an automated report include?
Should it be sent weekly or monthly?
1. How to send automated GA reports to clients
There are many many tools allowing you to send weekly or monthly reports to clients (even daily, in some rare cases). I’ll share three options with you, but there are dozens of other tools.
First one is Google Analytics itself. You can create a dashboard, add some widgets and then click on “Email” at the top left of the dashboard, select the frequency you want and click “Send”. It’s free, and it works. But it’s far from being great. It will send a screenshot attached as a PDF, which is over multiple pages and sometimes splits a single widget over two pages, making it hard to use. But then again, it’s free.
The second option, also by Google (and free) is Google Data Studio. This one is way more complicated to set up but comes with added flexibility. You can create nice dashboards, with data from various sources (although you need third-party connector providers for most of them, which aren’t generally free). It’s mostly great, with a confusing downside. It still doesn’t come with the possibility to send the reports by email. You need to automate that part by yourself by scheduling a weekly or monthly email, including the link to the dashboard.
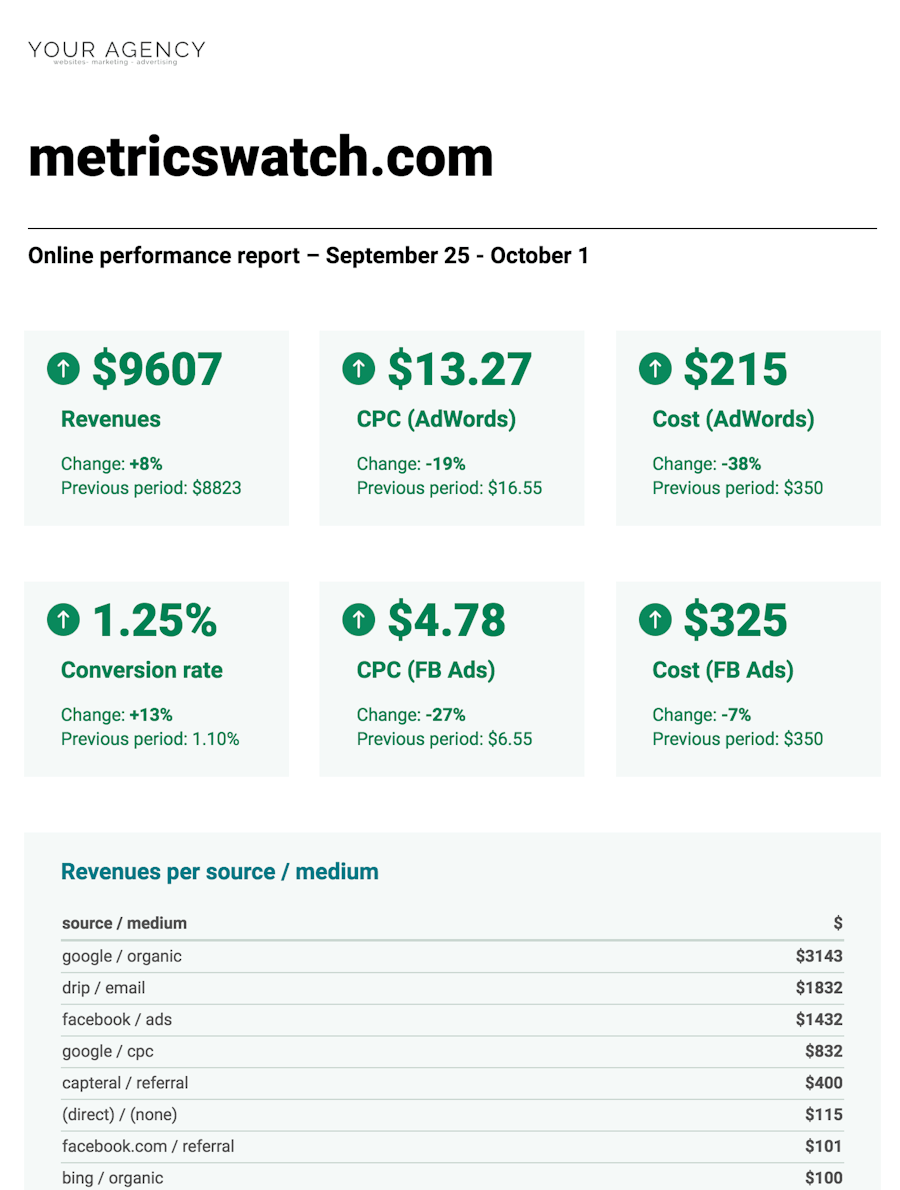
The third option, Metrics Watch, is specifically designed for agencies to send reports to their clients, by email.
Full disclosure: I founded Metrics Watch.
It’s not a PDF or a link to a web-based dashboard; it’s embedded directly in the email. It’s also white-label (logo, agency name, colors, can be sent from your domain, etc.). You can quickly decide to add any metrics to your reports and even include data from Facebook Ads, AdWords or Google Search Console, giving your clients a clear idea of what works and what doesn’t. You can also receive a preview of your report before sending it to your client and add an analysis or message. This is a paid solution.
No matter the tool you pick, I suggest you try and find the one that’s efficient, fits your needs and those of your clients.
2. What should be in a Google Analytics automated report?
Reports should be straightforward. Only keep what influences business decisions.
What does that include? Revenues, advertising costs, maybe CPC or CPA (if available) and lists of “source/medium” & campaigns bringing the most money. Start with that.
Only add what needs to be looked at weekly or monthly. For everything else, pass. If you or your client need to dig deeper once in a while, just go in Google Analytics.
Here’s an example of an effective report:

3. Should my GA client report be sent weekly or monthly?
It depends. How often will your clients take action based on reports? The answer differs from one client to the next. If the business doesn’t use an important toolset of digital marketing, a monthly report could be perfectly fine.
Conclusion
There is a ton of information in Google Analytics. In this post, I presented the most important metrics you should show your clients. Many other things could and should be looked at now and then, but these should be your starting point.
You can set up automated reports like these for your clients in 5 to 60 minutes depending on how familiar you are with Google Analytics. It’s easy to help your clients figure out what works for them so they can do more of it and make more money online. So do it: it'll strengthen your relationship for sure!
Early scoop: we have something else coming your way in a few weeks. A post about how to use GA alerts to monitor your online sales to make sure nothing breaks without you noticing (I have clients who lost tens of thousands of dollars because a broken shopping cart integration lasted a handful of hours).
Stay tuned, right here on Snipcart’s blog! ;)
If you've enjoyed this post, please take a second to share it on Twitter. Got comments, questions? Hit the section below!


