Debugging Vue.js: How to Fix Your App’s Frontend (w/ Tutorial)
A significant productivity milestone in my programming career was learning to debug correctly.
They do tell you it's important at school. But like programming, you won't get better unless you put in the hours.


Debugging happens at all stages of the dev cycle. Be it when you develop from scratch, maintain or refactor code, you'll need to debug.
We will mainly use Vue.js in this post, but some of the tips are broad enough to apply in any dev context, even to life if you squint hard enough.
Here's what we'll explore:
The tools needed to debug your frontend
Types of error classes you'll encounter
The best strategies to use
Hands-on Vue.js debugging tutorial
So open up your RAM-consuming browser, and let's start debugging!
Ain't no fools with tools (tools to debug in Chrome)


The first thing you should do when working on any project is setting up the proper tools. The tooling is obviously tied to the tech stack. It might seem trivial for a small project but monitoring your dependencies is crucial at scale.
My definition might be too broad, but I would define tooling as anything offering extra capabilities to working with a given tech. Adding font ligatures to VS code (banal, but so worth it)or using a whole observability framework are different kinds of "toolish" flavors.
As mentioned, setting up your tools should be done before debugging. There's nothing less tempting than zooming out and starting to fine-tune your toolbelt after finding a bug.
For our demo, we'll be working with an IDE and a browser. I am using VS Code as my IDE, so I installed the Vetur extension on Chrome, which, among other things, formats single file components.
You could further customize VS code and debug directly inside the IDE, but I prefer doing so in Chrome. If that's a path you want to explore, you can read more about this here.
As for the browser, I am using Chrome and will be using the Vue.js devtools. With this extension, you will be able to inspect Vue components directly, peek into the router, and time travel through your state history. It will save you much time if you work a lot with Vue apps, believe me.
If you're new to Vue, consider getting familiar with the basics here:
Debugging error types n' tricks
Much of the errors you will encounter will be due to:
→ Objects you’re accessing have different types than you thought.
→ Some values are simply missing.
Like when you think you're working in numbers, but you actually have the string "42". Much of these errors can be fixed by extending JavaScript with languages such as TypeScript, but we'll keep that for another conversation.
Another common issue:
→ Something that doesn't act like you thought it would
This could be language primitives or libraries. Heck, the hours I lost using array functions the wrong way are probably in the double digits. It's hard to know unless you explicitly research the expected behavior. That's why reading docs is so essential.
If you still haven't found your bug after looking at these two problems classes, then your issue might be in your business logic. Meaning you are just not doing what you have in mind. A trivial example would be that you want to add two numbers, but you are subtracting them. Here’s what I do when I know I'll be working on more complicated business logic:
I start by writing it in isolation, meaning outside the app it will live in. A neat tool to do so is Quokka.js. It lets you spin a REPL like JS runtime that makes prototyping instant. You can access variables values instantly and directly in the IDE.
If you're a junior developer, one of the most common mistakes you will make while debugging is to be convinced that the error is an advanced business logic one.
The debugger's playbook
Debugging is programming. And you will only get better by actually doing it. There are no shortcuts. That being said, there are some general debugging strategies that you should know, and experience will teach you when to use them.
Before we jump in the strategies, there are at least two helpful things you should know:
Logging.
Attaching to a process.
For this post, we are only interested in Vue.JS debugging, which lives in the frontend. In that case, logging is done with the console object, and attaching to the process is done by using a debugger statement.
You'll be using the console console.log function over and over. A neat trick that I learned early on is that you can log multiple objects with one call. You don't have to "stringify" and concatenate all your objects. You can do a single call like the following:
console.log("Here's some text and an object:", {'prop': {'nested': 'value'}}, ',and a second one:', [1,2,3,4])The other thing you need to know is to bind to the runtime. It is done simply with a debugger statement. Then you can read instruction by instruction.
These two methods let you inspect the state of your objects at runtime. It is crucial since you will make mistakes if you try to compute this cognitively. Now that you're armed with general error types and peeking methods in your app let's check some general strategies to pinpoint where your errors are.
Incremental testing
Strategies depend on the developing context of the bug. If you are developing something from scratch, you want to test it along the way incrementally. If you get an error, you know it happened between the last time you tried and now.
Binary search-inspired technique
If you just found a bug on an existing project and know it's relatively recent, you can use a binary search-inspired technique by rollbacking commit. Let's say you know the project didn't have the bug 40 commits behind; you can rollback 20 commits and check if the bug is present. If it is, you know the bug got added between the 40th and 20th commit; otherwise, it's in the last 20.
You repeat this until you get the exact commit where the bug got introduced. The plus value of doing this? If you find the actual commit where the bug is, it should be reasonably easy to fix if your commits are granular enough. This process might seem heavy but, in practice, you'll probably have an intuition about where the bug lies, and you might not need to split the commit history in half blindly.
This technique can be repurposed for logic also. It's one of the most known techniques in debugging called divide and conquer. You run your code until a chosen breakpoint. You check if it acts without the bug. If it does, the bug is in code further than the breakpoint and vice-versa. You repeat until you find where the bug is.


With only these two general strategies, you can go a long way. You'll still need to get your hands dirty and look around. Remember the three error types and throw some logging & debugger statements around.
You'll develop a good hunch over time.
One thing you must always remember is not to self-sabotage. After debugging the same problem for a while, you kind of get into a zone. Not the good one, the anti-flow zone. This state makes you hallucinate error proximity; you think the error must be so close since you've been working for so long.
Instead of working from first principles, you try brute-forcing your way out. If you can see yourself slipping in that pattern, take a break. Talk to someone, it can be a rubber duck, and revisit the problem after. I can't even begin to tell you how much time you'll save.
Tutorial: how to debug Vue.js?
To make things a little more concrete, we will scaffold a small toy project using the Vue CLI & the tooling we talked about earlier.
To do so, run the following commands:
npm install -g @vue/cli
vue create hello-world
Select the manual configuration and choose the following options:

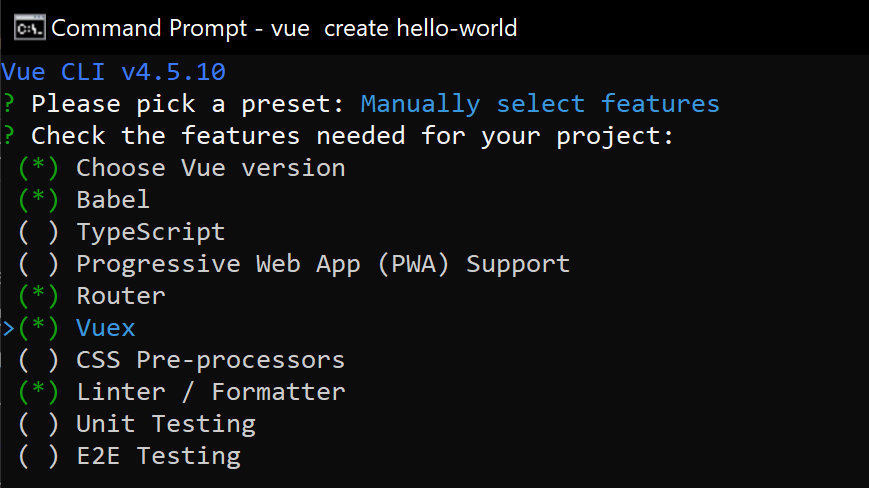
You can keep the default options for the other prompts. Now go ahead and boot up your project with:
cd hello-world
yarn serve
The stack we instantiated will most likely be the one used for any medium/large Vue projects. Vuex is here for your state management and vue-router for routing.
We'll add a state and some actions to Vuex to play with our tooling a bit.
Let's start by changing the Vuex store with this:
export default new Vuex.Store({
  state: {
    todos: ['The default task']
  },
  mutations: {
    addTodo(state, todo){
      state.todos = state.todos.concat(todo)
    },
    removeTodo(state, idx){
      state.todos.splice(idx, 1);
    }
  },
  actions: {
  },
  modules: {
  }
})
And let's swap the Home.vue component for this:
<template>
  <div class="home">
    <img alt="Vue logo" src="../assets/logo.png">

    <div>
      <input v-model='newTodo'>
      <button @click='addTodo'>Add todo</button>
    </div>

    <div v-for="(todo, idx) in todos" :key=idx>
      <span>{{todo}}</span>
      <button @click='removeTodo(idx)'>X</button>
    </div>
  </div>
</template>

<script>

export default {
  name: 'Home',
  data(){
    return {
      newTodo: ''
    }
  },
  methods: {
    addTodo() {
      this.$store.commit('addTodo', this.newTodo)
      this.newTodo = ''
    },
    removeTodo(idx){
      this.$store.commit('removeTodo', idx)
    }
  },
  computed: {
    todos(){
      return this.$store.state.todos;
    }
  }
}
</script>
Now, you have a bare-bone to-do app that lets you add and remove to-dos in the frontend. Let's add and remove a couple of to-dos and check our Vue extension.
We'll start with the Vuex panel. From there, you will see all the actions/mutations that have occurred in our store. We have access to the state at the time a given action/mutation was committed. It gives you the opportunity to time travel and see your state at any given point. This way, you don't have to reproduce by hand the same order of events to reach the bug. You can do exactly that within the tooling, which saves you some cognitive space.


You can also recommit actions to the store and "rebase" to a previous state. This way, you can find where the state becomes faulty and dig into the last action that made it so.
A little more advanced technique is the import/export of the state history. It could become convenient if you were to debug someone else's problem remotely as you could be asked by support. You could import their state history, look at past states and isolate the one where it went wrong.
If you open our little app and add some tasks and try to remove one, our remove button isn't working. What a neat little mistake to test our newly acquired knowledge. If we open our console and check our new Vue debug panel, you will see something like this:

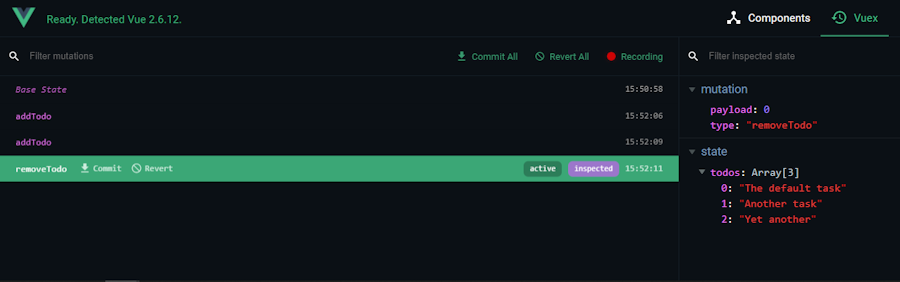
You can see we added two tasks by committing two "addTodo" events to our store. Then, we committed a "removeTodo" one. Although, as you can see by switching between the last "addTodo" and "removeTodo" events, the state remained still on the later event.
Now, we would have picked up the error because the UI wouldn't have updated, but some errors are much more subtle. It can be quite hard to track them when, for instance, they fail silently. In that case, integration tests could be the right way of catching them.
But, what exactly is happening here?
Errors aren't thrown in the console, so we're not accessing non-existent attributes. The example is a tad contrived, but let's dig as we would have otherwise. We know, thanks to our tooling, that "removeTodo" doesn't act as we intended. Let's add some logging to see the actual behavior of our function. Let's switch our "removeTodo" handler for:
removeTodo(state, idx){
  console.log(state.todos, idx)
  state.todos.slice(idx, 1)
  console.log(state.todos)
}
And the output:

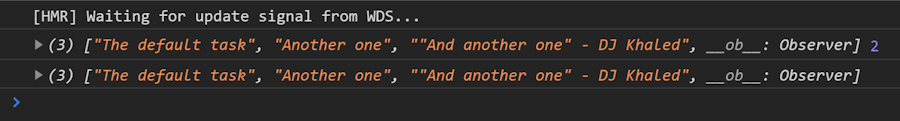
We see now that both our parameters, the state, and the idx, have the proper values, but the state is never mutated. Now you should ask yourself, “should I be mutating the array or returning the new state?”
A little dive in Vuex, and you'll confirm that you should be mutating here. There's only one place to look now! Is slice mutating the array!?
A glance at Array.prototype.slice() will confirm that it is not.
It "[…] returns a shallow copy of a portion of an array into a new array object selected from start to end (end not included) where start and end represent the index of items in that array. The original array will not be modified."1 By looking further, you'll realize that the function you had in mind was .splice(). Let's fix this and give our demo another shot.
We could have achieved the same result by using a debugger statement instead of logs. This example is relatively simple, so there's not much difference. Although I found that I instead use logs for errors with time, I'm not quite sure where to look at yet; while I prefer debuggers for errors, I know their approximate location.
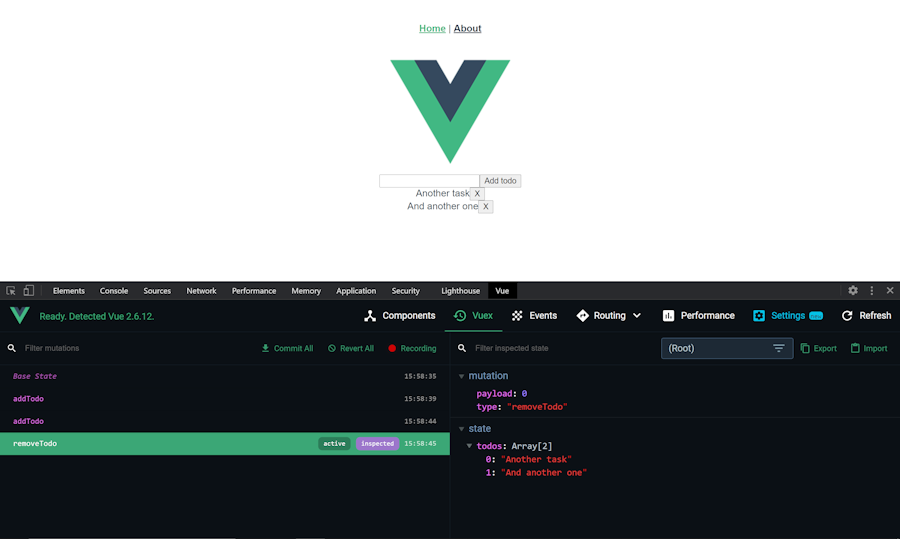
Here's now a working example of the state history after adding two to-dos consecutively and removing one after. You can see the payload of the committed action and the state after processing it.

Another important part of the extension is the components. It lets you look at the component tree and expose the local state of each component. It includes everything you would have in the script tag of your single file component, such as data, computed, props, etc. I find myself using this tab mostly to verify that props have the proper values and manually mutate local states to make sure edge cases and run ad hoc tests.
Closing thoughts
When debugging, a lot of work is actually done beforehand by healthy monitoring of your tech stack, enabling you to use the perfect tooling.
Then, when actively debugging, never forget the tango between getting your hands dirty with console logs and using your brain to think about what kind of error types could explain your observations.
As with anything, the more you do, the better you'll become.
Happy coding!
If you've enjoyed this post, please take a second to share it on Twitter. Got comments, questions? Hit the section below!


